Building Smarter Analytics for My Serverless Blog
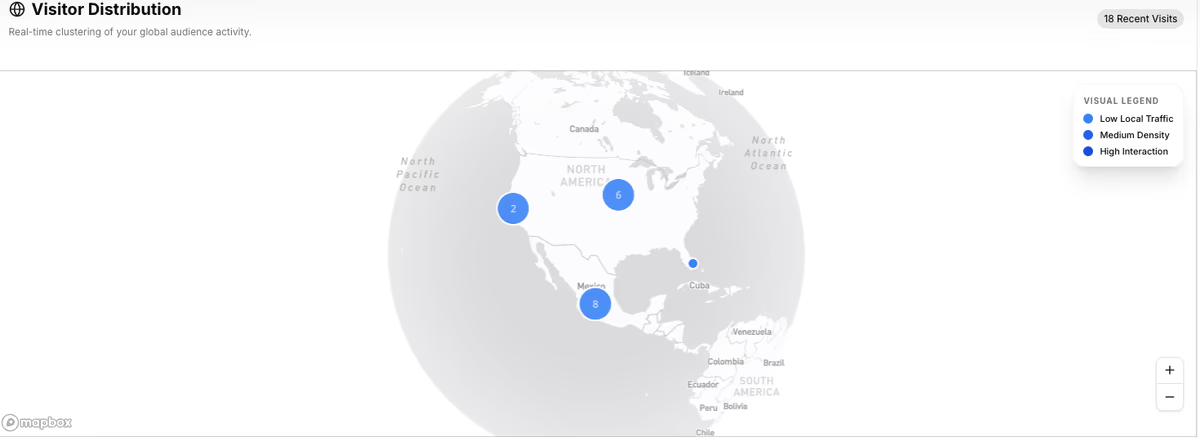
While I was building the dashboard for my blog, one key question naturally came up: Who is actually reading these posts, and where are they located?
Of course, we have tools like Google Analytics, and even the basic data provided by hosting platforms (in my case, Cloudflare). However, the internet is full of bots, and rather than just looking at generic traffic, my real goal was to understand my genuine readers and their specific interests. After doing some research, I found that my own infrastructure could provide me with exactly that, just by making a couple of adjustments.
Here is how I implemented a custom analytics solution using AWS CloudFront functions, AWS Lambda, DynamoDB, and Mapbox.
1. The Proxy: AWS CloudFront Functions
The first step was to route the data properly. I wanted to use an endpoint under my own domain for example, mydomain.com/api and proxy that request directly to my API Gateway endpoint (aws.apigateway.com/analytics). By setting up a CloudFront function to forward these requests, I avoided CORS issues and redundant backend calls.
To do this, I set up a lightweight CloudFront Function to strip the /api prefix before forwarding the request to the backend. This keeps the URL clean and routes the traffic seamlessly:
// CloudFront Function to rewrite the URI
function handler(event) {
  var request = event.request;
  var uri = request.uri;
  // Strip /api prefix if present
  if (uri.startsWith("/api/")) {
    request.uri = uri.replace("/api/", "/");
  } else if (uri === "/api") {
    request.uri = "/";
  }
  return request;
}
Alongside the proxy routing, it was critical to configure CORS correctly on the API Gateway. To ensure the frontend requests wouldn't be blocked and our custom tracking data passed through smoothly, I explicitly enabled the Access-Control-Allow-Headers configuration in API Gateway with the following headers: x-tz-offset, authorization, x-forwarded-for, content-type, origin.
This combination ensures that the CloudFront proxy works harmoniously with the API Gateway, allowing our backend Lambda to securely read everything from the payload to the exact forwarded user IP.
2. Filtering Out the Bots (A Script-Proof Lambda)
Once the data hits the analytics endpoint, an AWS Lambda function handles the request. Because I wanted the most accurate data possible, avoiding bot traffic was crucial. Fortunately, lists of common bot User-Agents are widely available online. I simply added a quick validation relying on the request headers to exclude them.
// Validating the origin to ignore crawlers and bots
const BOT_REGEX = /bot|crawl|spider|slurp|facebookexternalhit|bingpreview|embedly|quora|whatsapp|outbrain|vkShare|LinkedInBot|Pinterest|Slack-ImgProxy|Slackbot-LinkExpanding|SiteAnalyzerBot|Viber|SkypeUriPreview/i;

async function handleRecordView(event) {
  const userAgent = (event.headers && (event.headers["user-agent"] ||  event.headers["User-Agent"])) || "";

  if (BOT_REGEX.test(userAgent)) {
    console.log("Bot detected, skipping write:", userAgent);
    return { statusCode: 200, body: JSON.stringify({ message: "Skipped for bots"     }) };
  }

}
3. Accuracy in Reading: Grouping by Time Windows (Sessions)
When talking about accuracy, I needed to distinguish between mere page reloads and actual "session interactions". To solve this, I grouped the viewed pages into a 30-minute time window. If a user browses multiple pages or returns quickly within that timeframe, it counts as a single ongoing session rather than artificially inflating the view counter.
  // Logic used to separate visitor sessions
  const SESSION_THRESHOLD_MS = 30 * 60 * 1000; // 30 minutes

  for (const item of chronologicalItems) {
    // Unique identifier: Prefer visitorId or fallback to IP
    const vid = item.visitorId || item.ip || 'anon';
    const ts = new Date(item.timestamp).getTime();

    // If the visitor was seen within the threshold, it's the same session
    if (visitorsMap[vid] && (ts - visitorsMap[vid]) < SESSION_THRESHOLD_MS) {
      // Extend the session's 'last seen' time
      visitorsMap[vid] = ts;
      continue;
    }

    // A new session started
    visitorsMap[vid] = ts;
    sessionViews.push(item);
  }
4. Tracking Reader Interests and Daily Aggregations
On my admin page, I can now see all the registered users. I wanted to track their interests, so I categorized every post with tags. Every time a registered user reads a post, the Lambda function adds a +1 to their preferences under that specific tag. With this new data, it is incredibly easy to visualize what topics they care about most.
Additionally, I need a record to save daily aggregated data. One of the great advantages of a Non-Relational Database like DynamoDB is that if the row Analytics#Daily doesn't exist for the current day when a user enters the blog, the Lambda function will just create it on the fly.
  // 3. Update the daily aggregates
  const safeSlug = slug.replace(/\//g, "_").replace(/\./g, "_");

  // Using UpdateCommand with Expression to initialize records in DynamoDB!
  await docClient.send(
    new UpdateCommand({
        TableName: TABLE_NAME,
        Key: { PK: "ANALYTICS#DAILY", SK: date },
        UpdateExpression:
        "ADD totalViews :inc SET viewsBySlug = if_not_exists(viewsBySlug, :initSlugMap)",
        ExpressionAttributeValues: {
        ":inc": 1,
        ":initSlugMap": { [safeSlug]: 1 },
        },
    }),
  );

  // 4. Update Interests: Incrementing tags based on the user's reading history!
  if (userId && Array.isArray(tags) && tags.length > 0) {
    for (const tag of tags) {
      await docClient.send(
          new UpdateCommand({
            TableName: TABLE_NAME,
            Key: { PK: `INTEREST#USER#${userId}`,  SK: `TAG#${tag}` },
            UpdateExpression: "ADD #count :inc",
            ExpressionAttributeNames: { "#count": "count" },
            ExpressionAttributeValues: { ":inc": 1 },
          })
      );
    }
  }
5. Visualizing the World: The Interactive Map
Finally, all this analytics data wouldn't be complete without a visual way to see from which distant locations people are reading my knowledge base. Having converted and cached user IPs into high-precision coordinates via the Mapbox API, I display these points dynamically using a Marker Cluster map. This handles the data rendering fluidly in React, grouping traffic visually based on density.
import { Map, MapClusterLayer, MapControls } from '@/components/ui/map';
export default function VisitorClusterMap({ points, center, zoom }: VisitorClusterMapProps) {
// Convert geographic data to GeoJSON FeatureCollection for MapLibre clustering
const geojsonData = useMemo(() => {
return {
type: 'FeatureCollection',
features: points.map((p, i) => ({
type: 'Feature',
id: i,
geometry: { type: 'Point', coordinates: [p.lng, p.lat] },
properties: { country: p.country, city: p.city },
})),
};
}, [points]);
return (
);
}
Support the Journey.
I create content and share knowledge from the serverless frontier. If you found this helpful, consider buying me a coffee!
Buy me a coffee
Comments (0)
You must be logged in to comment.
Login to Comment